.....


-
YOUR WEALTH
... more
< -
YOUR
WORK
... more -
YOUR
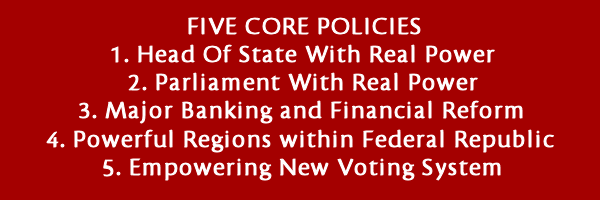
DEMOCRACY. ... more- 1.Vote separately for both Head of State and Parliament. More..
- 2.Autonomous regions bringing real democracy near to you. More..
- 3.Lifetime ban on politicians working for multinationals/finance
- 4.Lifetime ban on civil servants working for multinationals/finance
- 5.Electoral reform to make every single vote count. More..
-
YOUR
NATION
... more -
YOUR
FUTURE
...more



Virtue ....... Freedom ....... Aspiration ....... Wealth ....... Peace
Manifesto Introduction
The party defines itself by the five core policies. So that members and non-members clearly understand what the party stands for, these cannot be changed. At present they are principles the details of which will be decided according to the party constitution
All other policies will be decided according to the constitution
Below is a provisional list of headings for the Mani-festo each with a link to a page
That page contains provisional ideas for discussion.
Read this, as work in progress. Only DRP paid up members can comment and so if you want to have your say:
JOIN THE PARTY AND LEAVE A COMMENT !
A NEW CONSTITUTION FOR BRITAIN
Constitution Design
Executive
House of Commons Senate
Autonomous Regions
Democracy
Judiciary
Constitutional Court Supreme Court
Functions of Government Public Services Board Monetary Policy Board
ECONOMICS
Banking
Finance
Globalization
Monetary reform
TAXATION
Tax havens
Corporation tax
Income tax
Wealth tax
REGIONS
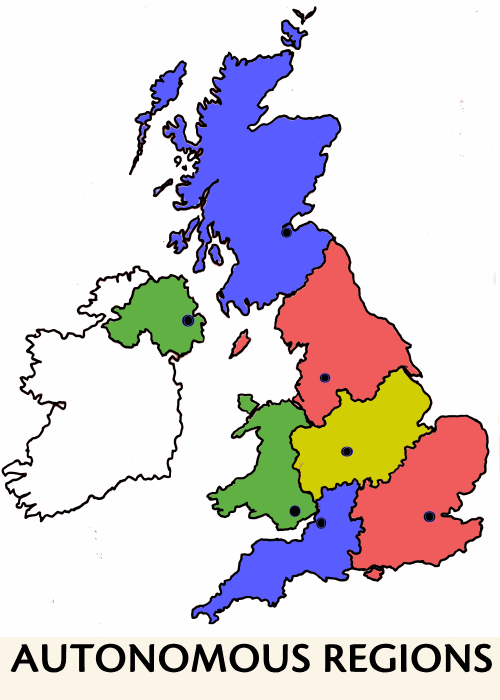
Federal nation
Autonomous regions
INDUSTRY
Skills training
Industry needs
Business development
Export assistance
PUBLIC SERVICES
Health
Education
Utilities
Transport Road Rail Air
Social Housing
Postal Services, Telecommunications
Police
Fire Service
Prisons
Probation Service
Waste/ pollution
FOREIGN AFFAIRS
Europe
Commonwealth
Islamic World
War
Military provision
SOCIETY
Families
Social exclusion
Minorities and race relations,
Citizenship
Economic enfranchisement
Church of England
Civil Society
Deprivation
Youth
Meritocracy
Immigration
Ethical Issues
Humanitarian issues/Animals
NATIONAL PLANNING
National planning strategies
Coordination of regions
Transport
LAW
Human rights
Liberty
Economic rights
Citizenship
Penal reform
Vice
Drugs
Prostitution
Gambling
CULTURE
Arts
Broadcasting/BBC
Press
POLITICS
Political parties
Corruption
Protest
Political philosophy
SPORT/LEISURE
ENERGY
ENVIRONMENT
AGRICULTURE
CEREMONIAL
CIVIL SERVICE
Government departments
Prosecution Service
ISSUES DISCUSSED IN THE NEWSLETTERS NOT LINKED TO THE MANIFESTO
HISTORY
British Republican History
OTHER NATIONS
THE KELLOWIAN ELECTORAL SYSTEM
Peter Kellow
There are doubtless many reasons why a large number of people are disillusioned with the democratic process. That none of the three main parties have any positive ideas to address the real problems we face and that all seem to say much the same thing in the race to occupy the hallowed middle ground must be a large part of it.
But the electoral system itself must surely also play a large part in inducing voter apathy and despair. It is in part responsible for the sense that the political establishment need not respond to people’s real concerns.
The electoral system we use, known as first-past-the-post (FPTP) has major faults. But then so do the usual alternatives that are put forward. These have until now always been some form of proportional representation (PR). In PR systems an attempt is made to make the representation of political parties in the elected assembly reflect national voting patterns. This is described by its advocates as more “democratic”.
But what do we mean by “democratic” in this instance? Historically there is no justification for equating proportional representation with democracy. Democracy has usually meant the winner of an election taking all the power and this is certainly how democracy has traditionally worked in Britain. Democracy is a contest with winners and losers,
The proponent of PR might have a stronger case if it were not for one concept that has, right from its beginnings in Ancient Greece, been intrinsic to democracy: this is rotation.
If we were electing a government one and for all, for all time, then PR might make a kind of sense for it would mean that all parties big and small would have at least some kind of say in government. But this is not the case. We have rotation. Election to office is for a fixed term.
Then we elect all over again
If you look at the representation at any one moment you could say that those parties that lost the last election have no representation – or relatively very little. After the 1997 election the Tories had in effect almost no say in government, but if, however, you look at the period of, say, from the second world war until now they have enjoyed considerable power.
The practice of rotation does a lot to dismiss the case for PR.
And a curious fact about supporters of PR, such as the Liberal Democratic Party, is that they want to introduce it with a referendum. But a referendum by its nature is FPTP and so will by its nature leave a large percentage of voters unrepresented.
The LibDems forced a referendum on a type of PR, Advantage Voting (AV), on the British people in May 2011 but it seemed to quite escape them that they considered a non-PR system virtuous enough to be used to try to introduce PR.
PR suffers from grave fundamental defects. But so does the alternative of FPTP. This is why I have devised a new electoral system called the Kellowian Electoral System. The Kellowian system, I believe, overcomes all the faults of both PR and FPTP, and delivers a system that will excite and interest the voters and promote a healthy democracy.
Before explaining how it works let us set out these faults of the existing systems. These have been well rehearsed many times, but let us remind ourselves of what they are. There are three in each case
The arguments against the first-past-the-post system are:
- Many voters in ‘safe’ seats are effectively disenfranchised as their vote will never make any difference to the outcome
- It is ‘undemocratic’ as one party can obtain power with a low percentage of votes. Matters are even worse when the turnout is low which it usually is these days
- It is difficult for new parties to make head way in spite of polling a good percentage of votes nationally
The arguments against proportional representation systems are:
- They result in weak governments with frequent coalitions and minority parties holding the key to forming governments
- They allow minority parties who may be extremist to gain representation
- PR systems, of whatever type, always do away with representation of a constituent by a single person. Thus any given MP can evade responsibility for looking after the people how voted for him or her. MPs no longer have “constituents” as such. Constituents have no one person to turn to,
All of these arguments against both systems are entirely valid.
The Kellowian system answers all of them. Too good to be true? Well, let’s see how it works.
The basic process is as follows
- The members of the assembly are elected by a first-past-the-post system exactly as we have now for our House of Commons.
- The difference arises once the MPs arrive in the Commons for each member has a vote “weighted” according to a calculation based on the overall national votes for their party. So if the weighting for a members of a party is, say, 1.2 and in a debate ten members of that party vote their vote counts as 10 x 1.2 = 12.
- This weighting is decidedly NOT to give the party a voting strength proportional to its share of the votes cast for that would simply introduce PR with all its evils. The weighting is decided by a simple transparent mathematical method that achieves the objectives of:
- making every vote count .
- achieving stable government
- making it a little easier for new parties to gain MPs
- preserving the position of independents
- disallowing extremist minority parties
So as far as the voter is concerned the process of voting is exactly as now. What is different is the fact that, because overall national voting is taken into account, there is not a single vote cast that is wasted.
So although the process of voting is the same, the effect of the votes will be quite different from the present system. Voters will quickly realise this and use their vote accordingly. It will mean above all that they will be much more inclined to vote for exactly the party they favour. Tactical voting will not be eliminated but it will be much reduced.
And perhaps more importantly voters will vote for they will know that every single vote, for any but the very small parties, in whatever constituency will affect the outcome in parliament,
The simplicity of the system is much in its favour. Admittedly it is just slightly more complicated than FPTP, but then the latter is brutal and unjust in its simplicity.
The Kellowian system is a million miles away from the complexity of a PR system that we already use in Britain for MEP elections. It is worth just noting the rules of this by way of comparison. These officially are described as follows:
- In a given region the allocated seats are awarded using a quota system. The quota is the total number of votes received by a party or independent candidate divided by the number of seats already gained in that region +1.
- So, for a party with no seats the number of votes received is divided by one, and so stays the same. If the party already has one seat then its number of votes is divided by two, if it has two seats it is divided by three, and so on.
- This means that the more seats you have already won, the harder it is to gain extra seats, so the overall allocation of seats is more proportional to the number of votes received.
- The first seat that a party wins goes to the first person on its list, the second seat to the second person, and so on, until the party has either not won any more seats or has run out of names on its list. An independent candidate is treated as though he or she were a party with only one name on its list.
Well, I doubt whether you got past the first sentence of that gobbledygook. But I repeat - that is a system that we already have in this country. And, no, it was not cooked up in Brussels. It is entirely a home grown invention. Other countries use other systems.
The description of the Kellowian system above is all that any voter really needs to know to participate fully in it. The way it responds to voter intentions will be something people will see in practice through use and so the full technicalities of it do not need to be understood for its benefits to be fully delivered.
What follows is more detail to substantiate the claim that the system avoids the failures of FPTP and PR. To demonstrate this, as well as explaining the details of the system I at the same time show how the voting in past elections would translate into a well-functioning House of Commons.
To calculate the Kellowian weighting for each party the election results are entered into a simple spreadsheet. The spreadsheet does the rest of the work. All we need are the number of seats that each party obtained, as in Row A below, and the national percentages each party obtained, Row B.
(For simplicity in this explanation, I will exclude the several Northern Ireland parties and other minority parties. The system has no difficulty accommodating minority parties and to show how these work, and I have included the two nationalist parties, the SNP and Plaid Cymru.)
Row |
Formula |
LAB |
CON |
LIBDEM |
SNP |
PC |
Totals |
|
| No of Seats | A |
Enter data |
355 |
198 |
62 |
6 |
3 |
624 |
| National %age | B |
Enter data |
35.20% |
32.40% |
22.00% |
1.50% |
0.60% |
92% |
Because some minority parties are not included there are only 624 seats as a total and the total percentage comes to less than 100%, To correct for this, in this example, it is necessary in adjust the percentages supplied by the official sources. This is done proportionately and so does not affect the principle. At the same the decimals are rounded off. This gives us Row C
Row |
Formula |
LAB |
CON |
LIBDEM |
SNP |
PC |
Totals |
|
| Adjusted Nat.%age | C |
B/TotB % |
38% |
35% |
24% |
2% |
1% |
100 |
The next line calculates the overall majority of the biggest party. For reasons which will become clear, the same calculation is done for every party and, as a result, all but one has a negative “overall majority”.
Row |
Formula |
LAB |
CON |
LIBDEM |
SNP |
PC |
Totals |
|
| Overall Majority | D |
A-[Tot A-A] |
86 |
-228 |
-500 |
-612 |
-618 |
|
Labour in this example of 2005 was the largest party with an overall majority of 86 (with the smaller parties left out of the calculation in this example)
Row |
Formula |
LAB |
CON |
LIBDEM |
SNP |
PC |
Totals |
|
| %age Seats | F |
A/Tot A % |
57% |
32% |
10% |
1% |
< 1% |
100% |
| Excess Voting Power | G |
F-B |
22% |
-1% |
-12% |
-1% |
<1% |
|
Row G is not necessary to the calculation. It shows the excess percentage of voting power in parliament that each party has over that suggested by the national votes polled. It shows how Labour is highly advantaged, the Conservatives are about even and the Libdems are very disadvantaged on this comparison
This completes the analysis of what the existing system of FPTP determined. Now, we calculate the Kellowian weighting for each party.
It would be perfectly possible at this stage to calculate a voting weighting for each MP in parliament so that in effect we would have PR in that the voting power of the various parties would exactly match the percentages obtained in the percentage of votes each party obtained nationally.
But PR is not the aim. So we need to perform a mathematical calculation on the percentages of national vote shown in row B. Theoretically we could choose almost any mathematically operation. The one I have selected was arrived at by trial and error.
The results of all the UK general elections from 1970 onwards were analysed according to different mathematical operations and the one that was selected was the one that best corrected for the problems created by both FPTP and PR described above. I selected the calculation whereby the proportion of votes gained nationally is subjected to a squaring to yield a different proportion.
[It so happens that there is a precedent for using the square for the so-called Penrose method (or square-root method) was devised in 1946 by Professor Lionel Penrose for allocating the voting weights of delegations in decision-making bodies. I arrived at the squaring independently by the trial and error method as I described.]
This works as follows.
Row |
Formula |
LAB |
CON |
LIBDEM |
SNP |
PC |
Totals |
|
| Square of Votes | H |
C x C |
1473 |
1248 |
576 |
3 |
< 1% |
3301 |
| %age Squared | J |
H/Tot H % |
45% |
38% |
17% |
1% |
<1% |
100 |
From this it is a simple matter to calculate the weighting we should give to a vote cast in parliament by any members of any party. The problem we are addressing is that indicated in Rows F and G above where Labour is vastly advantaged and the Libdems are disadvantaged.
(It is worth mentioning at this point that in all the elections of the last 25 years always has this kind of advantage, Labour simply has to gain less votes per seat in parliament due to boundaries and other factors. The Kellowian system goes some way to correcting this injustice.)
To calculate the weighting to give to the parliamentary votes, we simply divide the percentages in Row J by those in Row F.
Row |
Formula |
LAB |
CON |
LIBDEM |
SNP |
PC |
Totals |
|
| %age Squared | J |
H/Tot H % |
45% |
38% |
17% |
1% |
<1% |
100 |
| %age Seats | F |
A/Tot A % |
57% |
32% |
10% |
1% |
< 1% |
100% |
| Weighting | K |
J/F |
0.78 |
1.19 |
1.76 |
0.08 |
0.03 |
|
Row K, thus, gives us a weighting. But it has two problems. One is that the vote of Labour MPs will count less than one.
Mathematically this is less workable and it has the added disadvantage that the MPs concerned may feel psychologically put out. A voting right is sacred after all.
This matter is easily corrected, by applying the same factor to all party’s MPs, calculating the factor to return the Labour members’ vote to parity.
Row |
Formula |
LAB |
CON |
LIBDEM |
SNP |
PC |
Totals |
|
L |
Choose factor |
0.78 |
|
|
|
|
|
|
| Factor | M |
1/L |
1.27 |
1.27 |
1.27 |
1.27 |
1.27 |
|
| Weighting | N |
M x K |
1.00 |
1.52 |
2.24 |
0.11 |
0.03 |
|
This gives a satisfactory weighting for the three large parties but leaves a problem for the SNP and Plaid Cymru. Obviously they cannot have their voting power reduced by factors of 0.11 and 0.03. So we simply return their weighting to unity leaving the others as they are.
Row |
Formula |
LAB |
CON |
LIBDEM |
SNP |
PC |
Totals |
|
| Final Weighting | P |
Max (1,N) |
1.00 |
1.52 |
2.24 |
1.00 |
1.00 |
|
This completes the calculation of the Kellowian weighting for each party’s MPs.
We can now summarise the results as follows
SUMMARY UNDER KELLOWIAN WEIGHTING 2005 |
||||||||
|
Row |
Formula |
LAB |
CON |
LIBDEM |
SNP |
PC |
Totals |
Voting power numerically |
Q |
P x A |
355 |
301 |
139 |
6 |
3 |
803 |
Voting power as percentage |
R |
Q/Tot Q % |
44 |
37 |
17 |
1 |
0 |
100 |
Overall majority |
S |
Q-[Tot Q-Q] |
-93 |
-202 |
-526 |
|
|
|
SUMMARY UNDER PRESENT FPTP 2005 |
||||||||
|
Row |
Formula |
LAB |
CON |
LIBDEM |
SNP |
PC |
Totals |
Voting power numerically |
T |
A |
355 |
198 |
62 |
6 |
3 |
624 |
Voting power as percentage |
U |
F |
57 |
32 |
10 |
1 |
0 |
100 |
Overall majority |
V |
T-[Tot T-T] |
86 |
-228 |
-500 |
|
|
|
If we take the 2005 results the Labour/Conservative/LibDem split in the national polls was 35/32/22%, but in the commons the voting power was 55/31/10. The effect of the FPTP system was to enhance greatly Labour’s power in parliament – enough to give it an overall majority. The position of the Conservatives in the Commons as the second party corresponded roughly with their share of the national vote, but the big losers were the LibDems who had a derisory 10% on commons votes compared to a national turn out for them of 22%.
Of course, in deciding who is to form a government under the present constitution, it is the question of overall majority that is crucial.
(In the new republican constitution legislature will not choose the country’s leader – that will be subject to a separate election for president, Nevertheless, who runs parliament will be a vital question – as indeed it is in all existing presidential republics. A leader in parliament will still have to be selected.)
But for the present let us discuss the results in terms of our current system where the overall majority or not determines how the government will be made up and who will form it.
The big point in the 2005 election, we have considered, is that under Kellowian weighting no party has an overall majority. Now, it is certainly not an aim of this system to produce lots of hung parliaments and coalitions, for that is the very criticism we have alleged against PR. But on the other hand, as row B shows, in 2005 the Labour Party only achieved 35% of the vote and this was less than 3% more than the Conservatives. Under FPTP Labour waltzed into power with a sizeable majority.
But did they honestly deserve it? Did their big parliamentary majority even begin to reflect the electorate’s verdict? I think the answers are clear, and under Kellowian weighting they would have had to form a coalition or governed as a minority. That would surely have been more just.
For a concise presentation of how the results for all the general elections from 1987 to 2010, you can view the pdf’s here. These include a short discussion of how the Kellowian system succeeds in its objectives in each case.
For true septological anoraks (amongst which I count myself) you can see how the system works with every party included for the year 2005. There were with one or more MP. Of course it is this calculation that would be used in reality with all the parties.
Also if you want a spreadsheet to enable you to enter in other results then this can be purchased here
But in viewing these historical results, it cannot be stressed too strongly that under the Kellowian system, voting would be different.
Voters would understand that wherever and however they voted their vote would impact on the power that each party had in parliament. So they would vote for the party they favoured. Tactical voting would still exist but it would be vastly reduced.
And just as important, because every vote cast has an effect on the outcome in parliament, voter turnout will increase enormously.
The benefits of the Kellowian system for democracy cannot be overstated.
I will conclude with a brief discussion of the most recent election of 2010 and how Kellowian weighting would have changed the power configuration in parliament – always with the huge proviso that voters responded to a FPTP system with all its inadequacy and distortions not a Kellowian system.
I will skip the calculation and go straight to the summary whilst noting the weighting would be as follows
Row |
Formula |
LAB |
CON |
LIBDEM |
SNP |
PC |
Totals |
P |
Max (1,N) |
1.00 |
1.30 |
2.85 |
1.00 |
1.00 |
|
SUMMARY UNDER KELLOWIAN WEIGHTING 2010 |
||||||||
|
Row |
Formula |
LAB |
CON |
LIBDEM |
SNP |
PC |
Totals |
Voting power numerically |
Q |
P x A |
258 |
398 |
162 |
6 |
3 |
827 |
Voting power as percentage |
R |
Q/Tot Q % |
31 |
48 |
20 |
1 |
0 |
100 |
Overall majority |
S |
Q-[Tot Q-Q] |
-311 |
-32 |
-502 |
|||
SUMMARY UNDER PRESENT FPTP 2010 |
||||||||
|
Row |
Formula |
LAB |
CON |
LIBDEM |
SNP |
PC |
Totals |
Voting power numerically |
T |
A |
258 |
306 |
57 |
6 |
3 |
630 |
Voting power as percentage |
U |
F |
41 |
49 |
9 |
1 |
0 |
100 |
Overall majority |
V |
T-[Tot T-T] |
-114 |
-18 |
-516 |
|
|
|
As would be expected no party achieved an overall majority under the Kellowian system as they did not under FPTP. However the configuration is significantly different.
Most conspicuous of all is that Labour would have had not the least chance of entering into a coalition. Their overall majority calculates at -311 as opposed to the actual -114, And so the painful days of indecision whereby Gordon Brown hung on in No 10 would have been ruled out.
The other major difference is that due to the LIbdem’s (well-deserved) weighting of 2.85, they would have had a voting strength in parliament of 162 as opposed to 57. This would have produced a stronger coalition and given them more clout. Having polled a fifth of the votes, surely this can only be considered just.
In every election I have looked at since 1970, the same observations apply.
The Kellowian system delivers justice without letting in any of the bad aspects of PR.
At the same time it abolishes the inequities of the FPTP system and the apathy and rank injustice that it delivers time after time into that most priceless of our possessions – our democracy.
Leave a comment here
We need your views. Join the debate!
blog comments powered by Disqus
© COPYRIGHT. All content of this website unless otherwise indicated is the copyright of Peter Kellow. You may freely quote and republish content on condition that you acknowledge the author the source and give the link to the website www.democraticrepublicanparty.co.uk
ORDER NEWSLETTER
JOIN THE PARTY
DONATE
PARTY
FACEBOOK

EMBLEMS
CREATING A REPUBLICAN PARTY IN BRITAIN




If you would like a transcript of this website in book form, you will be able to reserve a copy at Amazon shortly either a Kindle or a Paperback version
Price to be advised..
ALL PREVIOUS
NEWSLETTERS
ALL PREVIOUS
BREAKING NEWS